I suppose that it might surprise a few people to learn that, before this weekend, I’d never attended a THATCamp. Surprise! It’s true. I blame this strange omission on several factors, including but not limited to proximity, awareness, and that special brand of conferential social anxiety that I bring to the table. Unconferences always sound great to me in theory, but then I realize that they’re basically designed to put participants in social situations that are my least comfortable. Ah well. I like to think I did okay this time around.
Anyhow, one of the things that these sorts of gatherings inevitably accomplish for me is to tip me onto tools that I hadn’t been aware of before. I left our Camp dead set on trying to incorporate Zotero more mindfully into my workflow this summer, and I saw a couple of other interesting tools that I may try in upcoming weeks. Chief among these is Textexture, which allows you to paste in a text to be visualized as a network (and exported as a GEXF file.
It’s pretty cool. Here’s my chapter from Dobrin’s collection on Ecology, Writing Theory, and New Media:
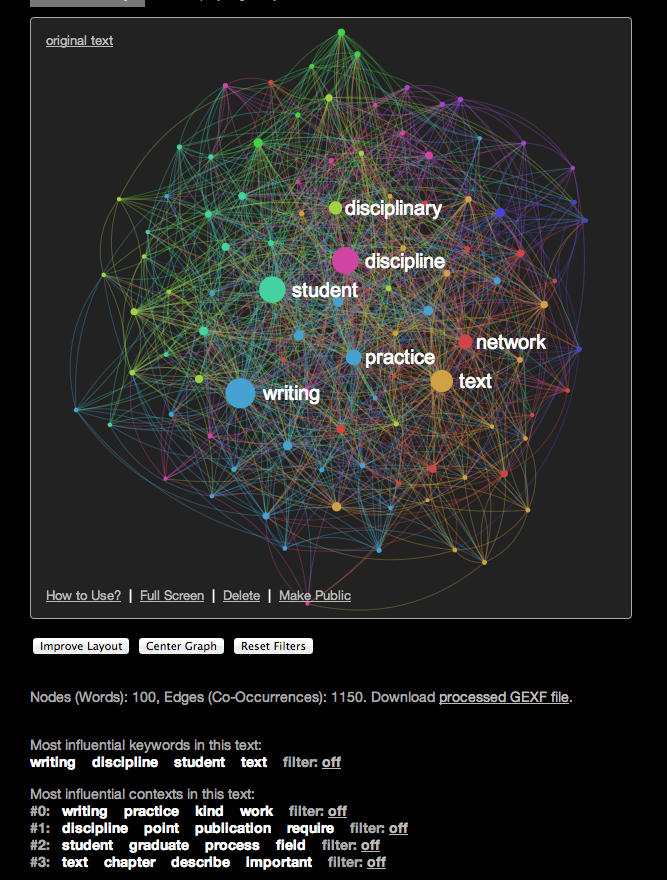
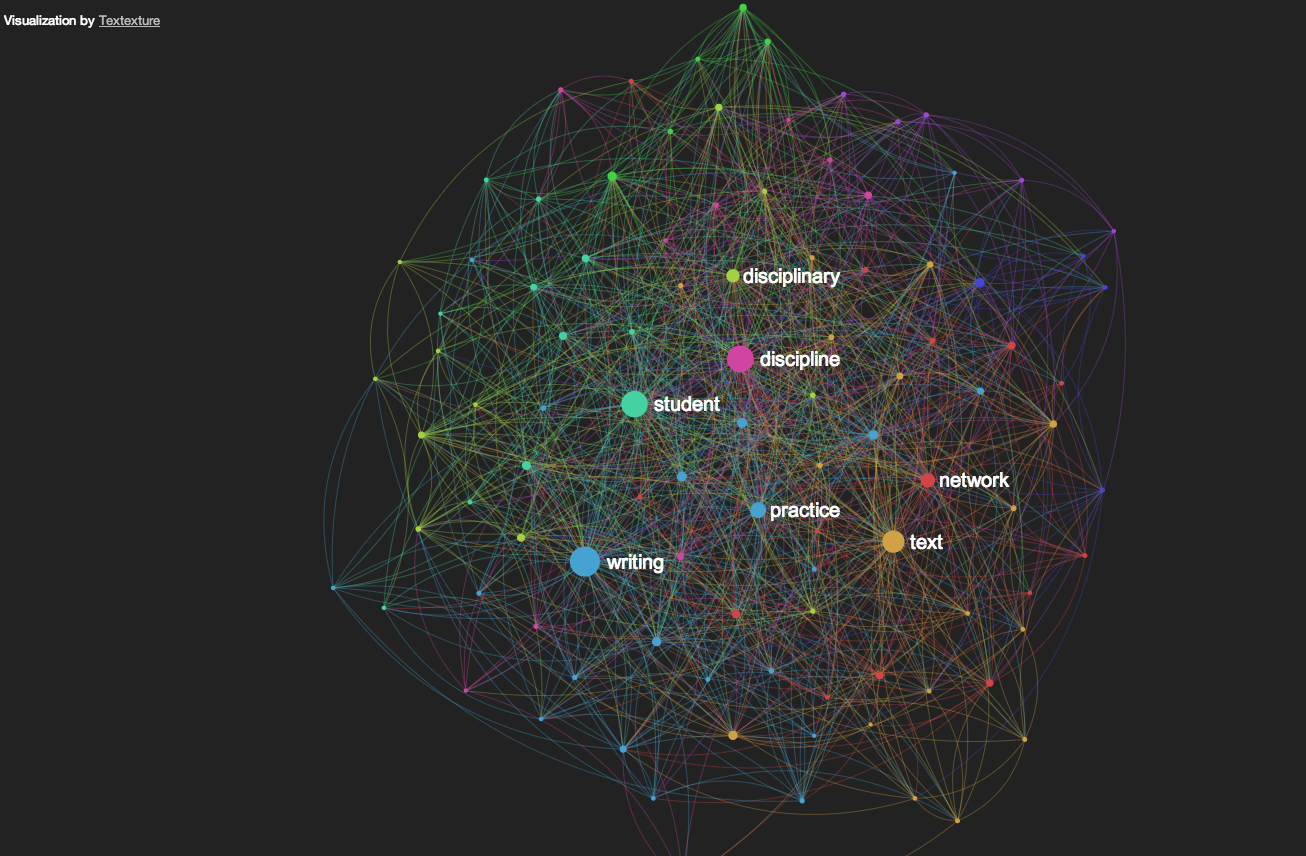
As you can see, the site also gives you a couple of topic clusters, which accounts for the different colors (toggling the filters restricts the diagram to that/those cluster(s)) Each of the nodes in the network can be rolled over to reveal the term and its closest friends in the text. It’s not a substitute for more robust graphing tools, but it’s a pretty nice for a web app. Here’s the full screen version of that network–more words appear as you have the room for them (you can also zoom in to portions of the graph–not here, but in Textexture itself).
So now you know how I’ll be spending the rest of the weekend.
Dmitry Paranyushkin
April 12, 2014 7:41 pmHi Colin, great work! By the way, you can embed Textexture graph directly on that page, so your readers can navigate it as well. Would be interesting to hear what insights you got from using Textexture…